| |
المؤلفون / Authors
الملخص / Abstract
الكلمات المفتاحية / Keywords
أقسام الملف
Introduction
Related work
Algorithm
Results and Discussion
References
|
| Using AI to detect Leukemia: Random Forest Classifier Provides Hope for Improved Patient Outcomes |
| |
| Aseel Alshoraihy(1) Housam Hasan Bou Issa(1) |
| Anagheem Ibrahim (1) |
| Saint-Petersburg Electrotechnical University |
| aibrakhim@etu.ru |
| |
| Abstract |
|
| Leukemia is a cancer of the tissues that make up the blood in the body, including the bone marrow and the lymphatic system. There are many types of Leukemia. Some forms of Leukemia are common in children. Other forms of Leukemia primarily affect adults. Leukemia usually involves white blood cells. White blood cells are the body's main line of protection to fight infection, and they grow and divide in an orderly way, according to the body's needs. However, in patients with Leukemia, the bone marrow produces excessive amounts of abnormal white blood cells, which do not work correctly. Leukemia treatment can be complex, depending on the type of Leukemia and other factors. |
|
| Nevertheless, some strategies and resources can help make treatment successful. This paper proposes a suggested algorithm for detecting Leukemia using a random forest classifier. The suggested algorithm is the first step in designing a model for detecting and diagnosing Leukemia depending on the count of blood cells (CBC) tests. |
|
| Keywords: Leukemia, CBC, machine learning, classification, random forest, detecting algorithms. |
|
| |
|
| 1.Introduction |
|
| Leukemia is a clonal reproduction of hematopoietic stem cells in the bone marrow [1]. It can be deadly if not diagnosed at an early stage. Usually, a complete blood count (CBC) or morphological image analysis is utilized to diagnose leukemia cells manually. Nevertheless, these techniques could be more time-consuming and objective, which ought to be specified. Leukemia is categorized as either Myelogenous or Lymphoblastic, leaning on the type of contaminated white blood cells. For instance, supposethe infected cells are lymphocytes, then leukemia will be classified as Lymphoblastic(ALL), and if he infected cells are monocytes and granulocytes. In that case, leukemia will be categorized as Myelogenous (AML) [2]. Complete blood count (CBC), kidney function test, liver function test, and uric acid level determination test. Examining a blood smear under a microscope is also necessary to look for cancerous cells. Also, bone marrow biopsy is the most common test to determine the type of leukemia. The spinal tap is another approach to look for cancer cells in the cerebrospinal fluid, which is the fluid that fills the spaces in and around the brain and spinal cord. |
|
| Cytogenic analysis, in which the lab looks at chromosomes in cells from samples of blood, bone marrow, or lymph nodes to determine if there are any genetic problems. For example, people with CML have an abnormal Philadelphia chromosome. Besides, Molecular diagnostics (PCR and FISH tests). The polymerase chain reaction (PCR) test can detect traces of cancer cells in the body. In contrast, the fluorescence in situ hybridization (FISH) test detects any chromosomal defects in the cell's DNA [3,4]. In times of epidemics, there is much talk about medical examinations and their importance for reassurance and prevention. Among essential examinations is the analysis of the "Complete Blood Count," known as "CBC." |
|
| Doctors define the CBC analysis as a complete blood picture analysis, which is a comprehensive definition of the importance of this analysis, which is the abbreviation of Complete Blood Count, or what is scientifically known as a complete blood count. This analysis mainly measures changes in the blood cells, divided into cells. For example, red blood "RBC," white blood "WBC," and platelets, each of which has a function within the human body, and therefore any imbalance in it indicates a problem; for example, red blood cells are responsible for ferrying oxygen to the organs of the body, while white blood cells are An essential part of the immune system [5]. In contrast, platelets are directly responsible for blood clotting, according to the specialized medical site "Healthline." |
|
| Therefore, this analysis becomes vital to know what is happening inside the human body, especially since its results are quick and easy. Therefore, it is possible to predict any health problems the patient has. If there are significant abnormalities in the CBC tests, it may indicate the possibility of cancer [6]. |
|
| Results for CBC tests are as follows: White blood cell count from 4,300 to 10,800 cells per cubic millimeter. A differential number of white blood cells should be distributed between granulocytes, lymphocytes, monocytes, eosinophils, and basophils. The red blood cell count is from 4.2 to 5.9 million red blood cells per centimeter. Platelet count ranges from 150,000 to 400,000 platelets per centimeter [7]. |
|
| The CBC test is a screening test for cancer. Screening helps detect leukemia or early detection. Cancer screening is a group of medical tests that, if the test result is negative, relieves the person applying for the test. However, if the test is positive, this does not indicate the presence of cancer but requires additional examinations and follow-up. |
|
| Suppose additional tests confirm the presence of cancer. In that case, there is no need to worry about early detection because the primary purpose of screening is to detect cancer in its early stages when there are no signs and symptoms. In addition, they are shorter, easier to access, and more effective during the treatment process. |
|
|
The CBC test is a standard and simple test in which blood cells are checked and counted. In cancers, the number of blood cells may increase or decrease, so the CBC test is used as a screening test.

|
|
| 2.Related work |
|
| CBC has been a concern in many research articles. For example, some essays used data mining approaches to analyze several diseases and phenomena, such as anemia, diabetes, thalassemia, heart diseases, cancer, Etc. Moreover, many others attempted to find directions to resolve if the patient is a leukemia patient or an iron deficiency patient [8]. For example, Durairaj et al. presented the case of using medical data mining and different data mining approaches for diagnosing Acute Myeloid Leukemia cancer [9]. This research discussed three crucial aspects: a comprehensive survey related to the selected task, the significance of the data mining approach in this regard, and finally, a comparison of the correct accuracy level of various models. At the same time, Shrivastava et al. examined the efficiency of classification-based pattern analysis techniques for diagnosing cancer [10]. Different techniques were used, such as SVM, k-NN, DT, and neural networks. Moreover, they utilized the Ant Colony Optimization method to optimize accuracy. |
|
| 3.Algorithm for detecting Leukemia using random forest. |
|
| |
|
|
Python is widely used in network applications, software development, data science, and machine learning (ML). For example, Python is used to conduct the suggested algorithm. Developers use Python because it is efficient, easy to learn, and can run on many platforms. A set of libraries, such as the Pandas library, have provided flexible and improved data structures to manipulate time series data and structured data, such as tables and arrays. For example, one can use Pandas to read, write, merge, filter, and aggregate data. It is also used by many people in data science, data analysis, and machine learning (ML) tasks. NumPy is a famous library developer used to easily create and manage arrays, manipulate booleans, and perform linear algebra functions. NumPy sustains integration with multiple languages, such as C and C++. Random forest is used in machine learning. The random forest consists of several decision trees, independently trained on subsets of the learning dataset (packing method). Each produces an estimate, the set of results that will give the final prediction that produces the slightest variance. In short, it is a matter of taking inspiration from different opinions and dealing with the same problem to understand it better. Each model is randomly distributed into subsets of decision trees. The final estimation selects the most common response category in random forest classification. Instead of using all the results obtained, the selection is made by looking for the predictions that appear most often.
.
|
|
| The database used was contributed by Kaggel and done by researchers and doctors from Qatar University, Doha, Qatar, and Dhaka Medical College Hospital, Bangladesh. They collected a database of complete blood counts and corresponding patients’ outcome. It included the information of 103 patients and was collected between 12 April and 31 August 2020 [10]. |
|
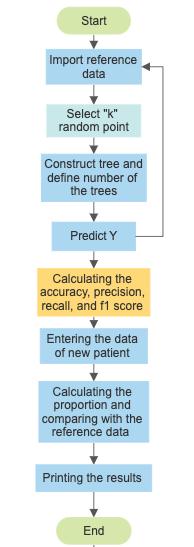
| The suggested algorithm is illustrated in figure (1). |
|
 |
|
| Figure 1 Chart flow for an algorithm for detecting leukemia. |
|
| Since the random forest collects several trees to predict the category of the data group, some decision trees can predict the correct output, while not others may predict. However, together, all trees predict the correct output. Therefore, there are two assumptions of a better random forest. First, there must be some substantial reinforcements in the variable of the data group so that the work can expect accurate results instead of the result of its guess. |
|
| Fllions of each tree should have external connections. |
|
| The random forest works in two phases: the creation of the random forest by combining the N decision tree, and the second is a prediction of each tree created in the first stage. The process of working in the steps can be explained. |
|
| 1. Select K random data points from the training group. |
|
| 2. Building decision-making trees associated with specific data points (sub-groups). |
|
| 3. Choose N for the decision trees wanted to build. |
|
| 4. Repeat steps 1 and 2, respectively. |
|
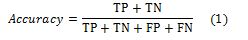
| On the used dataset, some metrics are evaluated. Firstly, as shown in equation (1), the accuracy is estimated as the number of all correct predictions divided by the total dataset number. |
|
 |
|
| Where true positive for correctly predicted event values, false positive for incorrectly predicted event values, true negative for correctly predicted no-event values, and false negative for incorrectly predicted no-event values. |
|
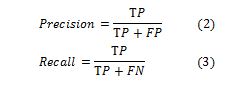
| Secondly, Precision Also called Positive predictive value |
|
| The ratio of correct optimistic predictions to the total predicted positives. |
|
| As well as Recall Also called Sensitivity, Probability of Detection, and True Positive Rate, The ratio of correct optimistic predictions to the actual positive examples is shown in equations (2) and (3). |
|
 |
|
| |
|
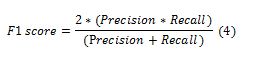
| Finally, the F1 score is the harmonic mean of Precision and Recall. It takes both false positives and false negatives into account. Therefore, it performs well on an imbalanced dataset. F1 score gives the same weightage to recall and Precision. |
|
 |
|
| 4.Results |
|
| |
|
| Artificial Intelligence (AI) has emerged as a robust medical diagnosis and treatment tool in recent years. One area where AI has shown significant promise is in the detection of leukemia. Several recent studies [13-15] have explored the potential of AI in the early detection of leukemia. For example, some studies have developed deep learning-based algorithms to detect leukemia from microscope images or peripheral blood smear images, achieving high accuracy rates of up to 97.3%. Other studies have used machine learning techniques to develop automated systems for a leukemia diagnosis, achieving accuracy rates of up to 93.75%. In addition, deep learning algorithms, which have shown great promise in image recognition tasks, have also been employed in this field. These algorithms can learn to detect patterns and features in images that may be difficult for human experts to identify, enabling them to detect leukemia at an earlier stage. Other researchers [16-18] are exploring the use of AI to detect leukemia using genomic data. Genetic mutations in blood cells cause leukemia, and by analyzing genomic data, AI algorithms can identify specific mutations associated with the disease. Such analyses can help to detect leukemia early and guide personalized treatment options. The proposed approach detects Leukemia depending on the CBC tests with an accuracy equal to 77.60% which considered good enough as a first step. The suggested algorithm depended on a reference database, concentrated on specific parameters in the CBC test, and compared it with the ranges for healthy individuals. It considers that the normal range for white blood cells (WBC) is from 3.6 to 11.0 x10⁹/L, while red blood cells range is 4.5 to 6.5 x10¹²/L, Haemoglobin range from 130 to 180 g/L and the Platelet count range from 140 to 400 x109/L [11]. |
|
| |
|
| Future work will increase the quality of the reference database and different test classifiers and compare the confusion matrices of different classifiers to decide the best approach. |
|
|
|
| 5.References |
|
| 1. Davis, A., Viera, A.J. and Mead, M.D., (2014). Leukemia: an overview for primary care. American family physician, 89(9), pp.731-738. |
|
| |
|
| 2.Shafique, S., Tehsin, S., Anas, S. and Masud, F. (2019). March. Computer-assisted acute lymphoblastic leukemia detection and diagnosis. In 2019 2nd International Conference on Communication, Computing and Digital systems (C-CODE) (pp. 184-189). IEEE. |
|
| |
|
| 3.Quintás-Cardama, A. and Cortes, J.E. (2006). July. Chronic myeloid leukemia: diagnosis and treatment. In Mayo Clinic Proceedings (Vol. 81, No. 7, pp. 973-988). Elsevier. |
|
| |
|
| 4. Bullinger, L., Döhner, K. and Döhner, H., (2017). Genomics of acute myeloid leukemia diagnosis and pathways. Journal of clinical oncology, 35(9), pp.934-946. |
|
| |
|
| 5. Gulati, G., Uppal, G. and Gong, J., (2022). Unreliable automated complete blood count results cause, recognition, and resolution. Annals of Laboratory Medicine, 42(5), pp.515-530. |
|
| |
|
| 6. Haider, R.Z., Ujjan, I.U., Khan, N.A., Urrechaga, E. and Shamsi, T.S., (2022). Beyond the in-practice CBC: the research CBC parameters-driven machine learning predictive modeling for early differentiation among leukemias. Diagnostics, 12(1), p.138. |
|
| |
|
| 7. Erdim, I., Erdur, O., Oghan, F., Mete, F. and Celik, M., (2017). Blood count values and ratios for predicting sleep apnea in obese children. International journal of pediatric otorhinolaryngology, 98, pp.85-90. |
|
| |
|
| 8. Minnie, D. and Srinivasan, S., (2012). Clustering the preprocessed automated blood cell counter data using modified K-means algorithms and generation of association rules. International Journal of Computer Applications, 52(17). |
|
| |
|
| 9. Durairaj, M. and Deepika, R., (2015). Prediction of Acute Myeloid Leukemia Cancer Using Data Mining-A Survey. International Journal of Emerging Technology and Innovative Engineering, 1(2), pp.94-98. |
|
| |
|
| 10.Shrivastava, S.S., Choubey, V.K. and Sant, A., (2016). Classification based pattern analysis on the medical data in health care environment. International Journal of Scientific Research in Science, Engineering and Technology, 2(1). |
|
| |
|
| 11. Complete blood count database, Retrieved from: https://www.kaggle.com/datasets/tawsifurrahman/covid19-complete-blood-count-clinical-database (accessed: 20.01.2023) |
|
| |
|
| 12. Ward, P.C., (2000). The CBC at the turn of the millennium: an overview. Clinical chemistry, 46(8), pp.1215-1220. |
|
| |
|
| 13.Rehman, A., Abbas, N., Saba, T., Rahman, S.I.U., Mehmood, Z. and Kolivand, H., (2018). Classification of acute lymphoblastic leukemia using deep learning. Microscopy Research and Technique, 81(11), pp.1310-1317. |
|
| |
|
| 14. Ghaderzadeh, M., Asadi, F., Hosseini, A., Bashash, D., Abolghasemi, H. and Roshanpour, A., (2021). Machine learning in detection and classification of leukemia using smear blood images: a systematic review. Scientific Programming, 2021, pp.1-14. |
|
| |
|
| 15. Anilkumar, K.K., Manoj, V.J. and Sagi, T.M., (2021). Automated detection of leukemia by pretrained deep neural networks and transfer learning: a comparison. Medical Engineering & Physics, 98, pp.8-19. |
|
| |
|
| 16. Eckardt, J.N., Bornhäuser, M., Wendt, K. and Middeke, J.M., (2020). Application of machine learning in the management of acute myeloid leukemia: current practice and future prospects. Blood Advances, 4(23), pp.6077-6085. |
|
| |
|
| 17.Angelakis, A. and Soulioti, I., (2021). Diagnosis of acute myeloid leukaemia using machine learning. arXiv preprint arXiv:2108.07396. |
|
| |
|
| 18. Muhsen, I.N., Shyr, D., Sung, A.D. and Hashmi, S.K., (2021). Machine learning applications in the diagnosis of benign and malignant hematological diseases. Clinical Hematology International, 3(1), p.13. |
|
|
|
|


